Lap Track Racing Tutorial
Welcome to Lap Track Racing, a web platform that allows you to analyze your cyclocrosss racing performance like never before! In this tutorial, we'll guide you through the steps to get started with Lap Track Racing and help you make the most out of this powerful tool.
Step 1: Double check the settings
- Access the Lap Track application: https://laptrack.racing.
- Look for the settings section and expand it. Now check which units of measurement system you'd like Lap Track to work in. The options are Imperial (miles, feet and miles per hour) or Metric (Kilometers, Meters and Kilometers per Hour.).
 Units of Measurement selection
Step 2: Loading a race datafile
- Lap Track Racing supports different data file formats: FIT, GPX, and TCX.
- Make sure to make your data file available on your computer, by either loading it directly from your Bike Computer, or downloading it from your online platform account such as Strava, TrainingPeaks etc. Note: your data stays locally on your browser. Alternatively you can dowload the race file we used for this tutorial here: shedpark-2024.fit. Or click on this link to auto load the shedpark-2024 file.
-
Once the file is available on your computer, click on the Lap Track 'Choose File' button and locate, select and open the file.
 Choose File
 -
Once the file is loaded you are all set to start analyzing.
Step 3: Understanding the Lap Track Racing Interface
- The Lap Track Racing interface is divided into several sections:
- Adjust race start / finish: Initially closed, but once openeded allows you to tweak the start and end of a race.
- Lap Analysis: Provides detailed analysis of your lap times, including sector times, split times, and lap charts.
- Lap selectors: Displays a table with lap statistics and allows you the select an individual lap for analyzing.
- Map: Display a map of the track, showing the start and finish locations and the current position. It also allows you to choose from the various Map types.
- Charts: Displays various charts of key data points of your race.
- Zone Legend: Displays the legend of the colors used in the Map type.
- Playback: Provide controls to playback your race, by showing the datapoints 1 by 1. You can choose from 5 different playback speeds.
- Settings: Allows you to review / change the application settings.
- History: Gives a history of improvements we made to Lap Track in chronological order.
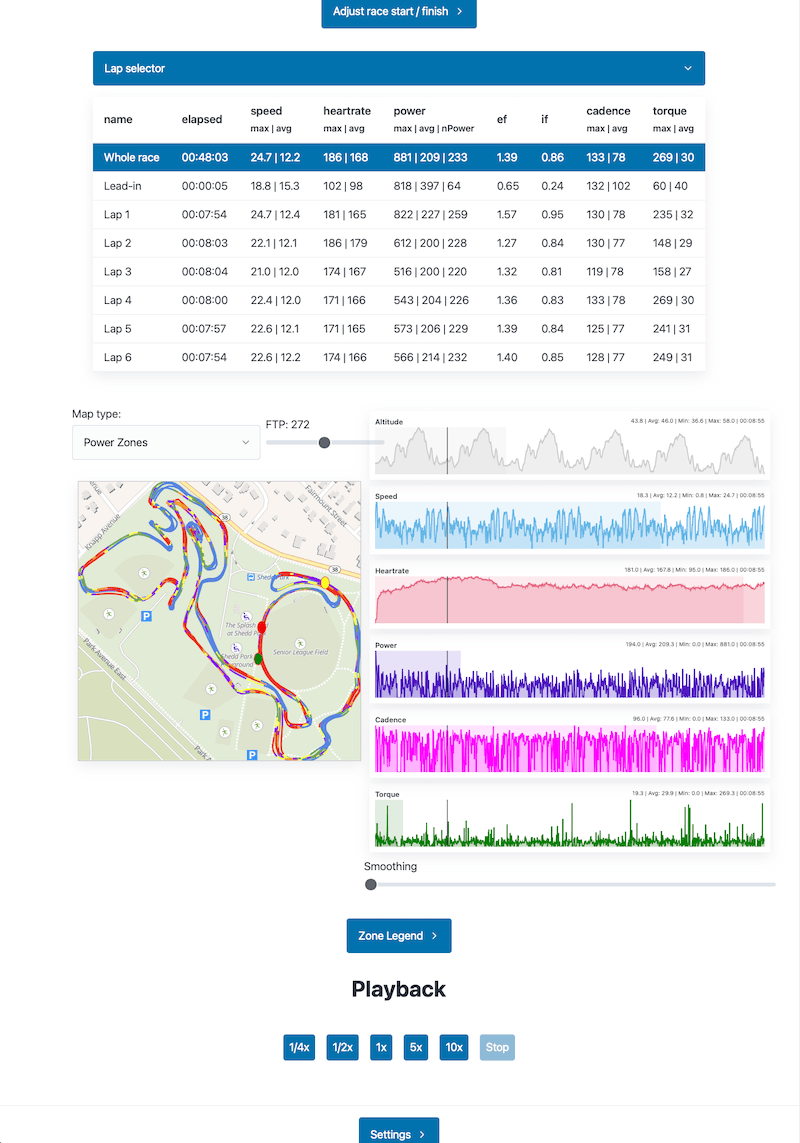 Overview of Lap Track Racing interface.
- Familiarize yourself with the interface and explore the different sections to get a better understanding of your racing performance.
Step 4: Adjusting the race start and/or finish times.
To detect the start and finish of a race Lap Track uses an algorithm based on the Power or Speed data of the file.
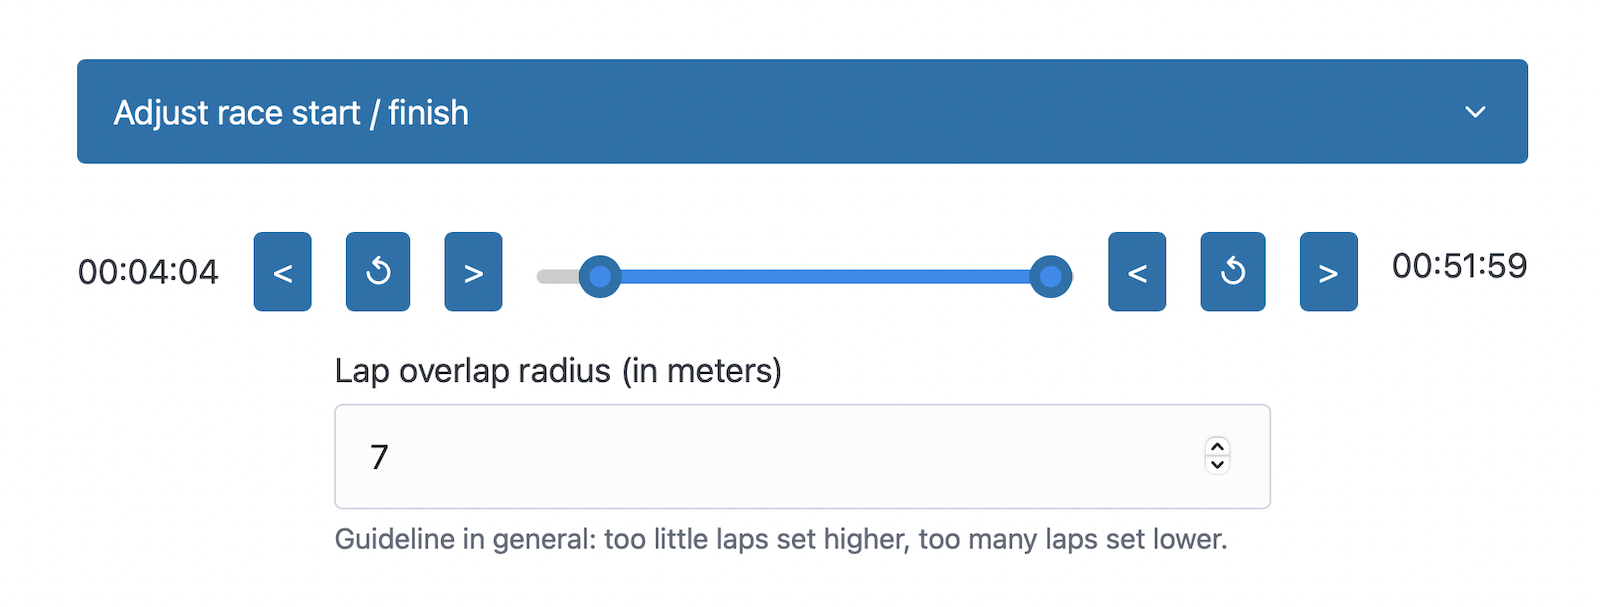 Adjust Start and Finish
The algorithm to determine the start and finish locatione may not always be correct, in that case use the following steps to correct them:
- First check the Lap table and verify the correct amount of laps are identified.
- Then check the location of both the start (green dot) and finish (red dot) on the Map.
- If these are not correct, click on the 'Adjust race start / finish' button to show the adjustment controls.
- If the Finish location is not correct use the Finish controls to move the Finish dot to the correct poistion.
- Next use the Start controls to adjust the Start position.
- With the Reverse button the Start or Finish location can be reverted, to the calculated values.
- If too many or too little laps are detected tweak the Lap overlap radius. Set to less sensitive (higher) when too many laps are detected and lower if not enough laps are detected.
Step 5: Analyze laps with the Lap Selector table.
Once the race data is loaded Lap Track Racing displays data for the whole race, the lead-in section (From the start to the first time passing the finish line) and the following laps. The table displays the following race data:
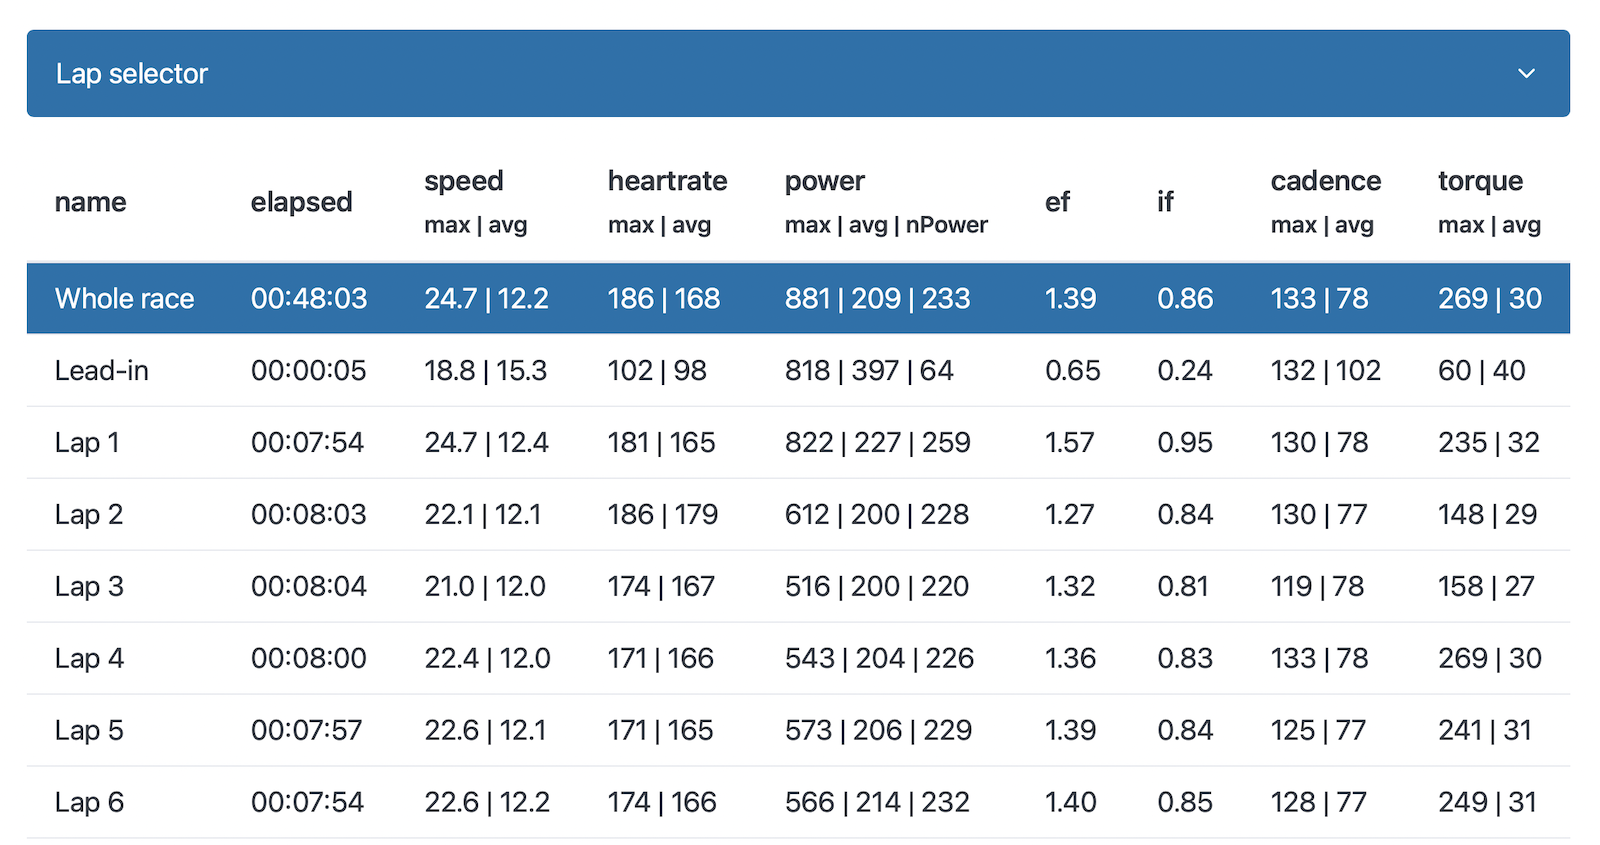 Lab Selector Table
- The Elapsed column shows the time it take to complete the lap.
- The Speed columns show the maximum and average speed for a lap.
- The Heartrate column displays the maximum and average heartrate for a lap.
- The Power column show the maximum, average and NPower output for a lap. The NPower column indicates how bursty the power output was.
- EF - The Efficiency column displays how efficient you were ride as it is a result of nPower/Hearrrate. The higher, the more efficient the effort was.
- IF - The Intensity Factor column indicates how close to your FTP the NPower was. If it is less than one, it is lower than the FTP, and more than 1 is higher than the FTP.
Keyboard support By clicking on a lap row, the map and charts below will only show the track info for that lap. When the table has focus you can also use the keyboard to select a lap, where 1 = Lead-in, 2 = Lap 1, 3 = Lap 2, etc and 0 resets it back to the whole race.
Step 6: Analyze your race with the Map
The map view shows your the tracks from the race. The tracks are color coded by the map type. The following map types are available, assuming you have both heartrate as well as power data. If power and/or heartrate is not available there will be less map types.
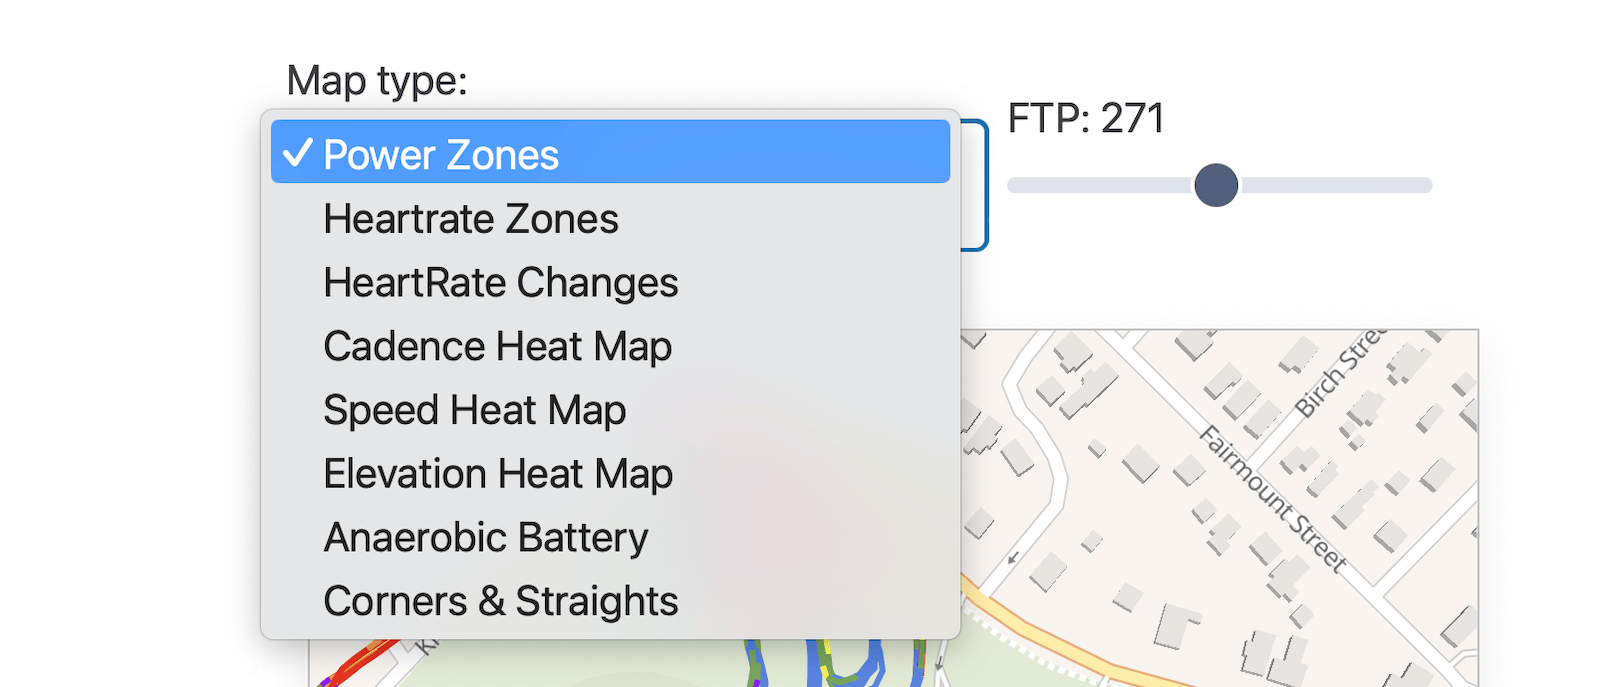 Map type Selector
On the map there are three color markers(circles). The green marker indicates the start of the race, then red marker shows the finish and the yellow marker show to current position. The use of the latter we discuss in the Chart Analysis and Playback steps.
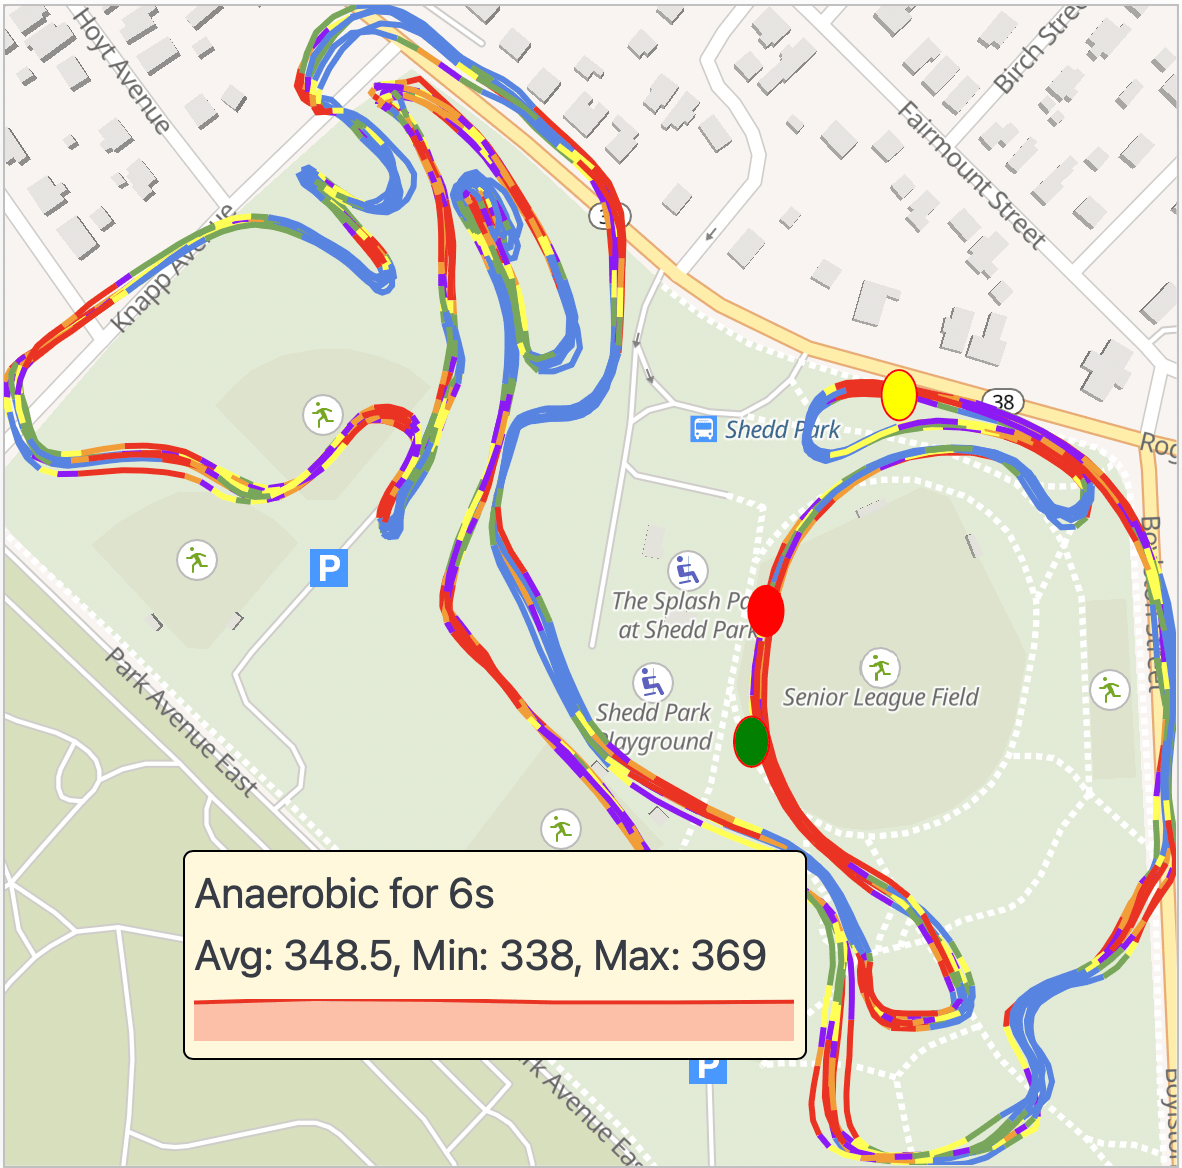 Map showing tracks colored by Power zones
By default the tracks of the whole race are displayed on the map, but you can use the Lap Selector to choose an individual Lap to display in the Map
Note the meaning of the colors is explained in the Map Legend, which we discuss below.
When hovering with the mouse of a color track section shows additional data in a tooltip. It shows what zone, how long the section lasted, the average, minimum and maximum value and a little trend line of the section.
Keyboard support By focusing the map or the charts (clicking on it, or tabbing to it) the keyboard can be used to select a lap, where 1 = Lead-in, 2 = Lap 1, etc and 0 resets it back to the whole race. Also can the current marker be controlled with the left and right arrow keys, which makes it easy to walk through the race datapoints step by step.
- The default map type is Power Zones. It shows the tracks color coded by the Power zone you were riding in at that moment. The Power zones are calculated based on your Functional Threshold (FTP) which you can set to match yours using the FTP slider.
- The following map type shows your Heartrate Zones. The zones are based on your Heartrate threshold, which you can adjust using the Heartrate Threshold slider. Note in a typical cyclocross race, this very quickly turn red, the hardest zone.
- The third map type shows Heartrate Changes in colors. This is useful as it allows you to spot where you are recovering from efforts and where you are ramping it up again.
- The next map type shows the tracks in color coded for Cadence. It allows you to see what your RPM was a the various sections of the course. Can be helpful to see if you were in the right gear at the various sections.
- The Speed map type shows your speed on the course. It allows to see where you accelarated or where your had to slow down.
- Another useful map type is the Elevation which give you a feel where the lower and higher parts of the course are and as a result you had to climb/descend.
- Another Power related map type is the Anaerobic Battery map type. It is basically a simplied Power Zone map and shows where you were riding above (Anaerobic) or below (Aerobic) your FTP. It also display the FTP slider to it to your value.
- A very cool map type is the Corners and Straights map, it shows, where the straights and the turns on the course are. The power in this map lies in the tooltip when hovering over a corner section. It displays the Entry and Exit Speed, the Percentage change and for Corners it also display the degrees of the corner (ie how sharp the corner is).
 Tooltip showing entry / exit speed
Step 7: Analyze your race with the Charts
There are multiple line charts, and like the map types, the number of charts depends on whether you have Power and / or Heartrate available in your data file.
 Example speed chart
Each chart has a title (top left), a summary (top right), the line chart itself, a horizontal bar chart (in the back ground) and a datapoint marker (black vertical) line:
- The title shows the data that is displayed in the chart, for example Speed.
- The summary lists the current value (indicated by the datapoint marker), the average, the minimum, the maximum value in the linechart and the timestamp of the current datapoint marker.
- The line chart plots all the datapoints for the duration of the race (or lap).
- The horizontal bar chart shows the current datapoint value as a percentage of the maximum value.
- The datapoint marker is controlled by hovering over the line chart and controls: the current value and timestamp in the summary, the value displayed in the barchart, the datapoint markers in the other charts, and the current marker (yellow) on the map.
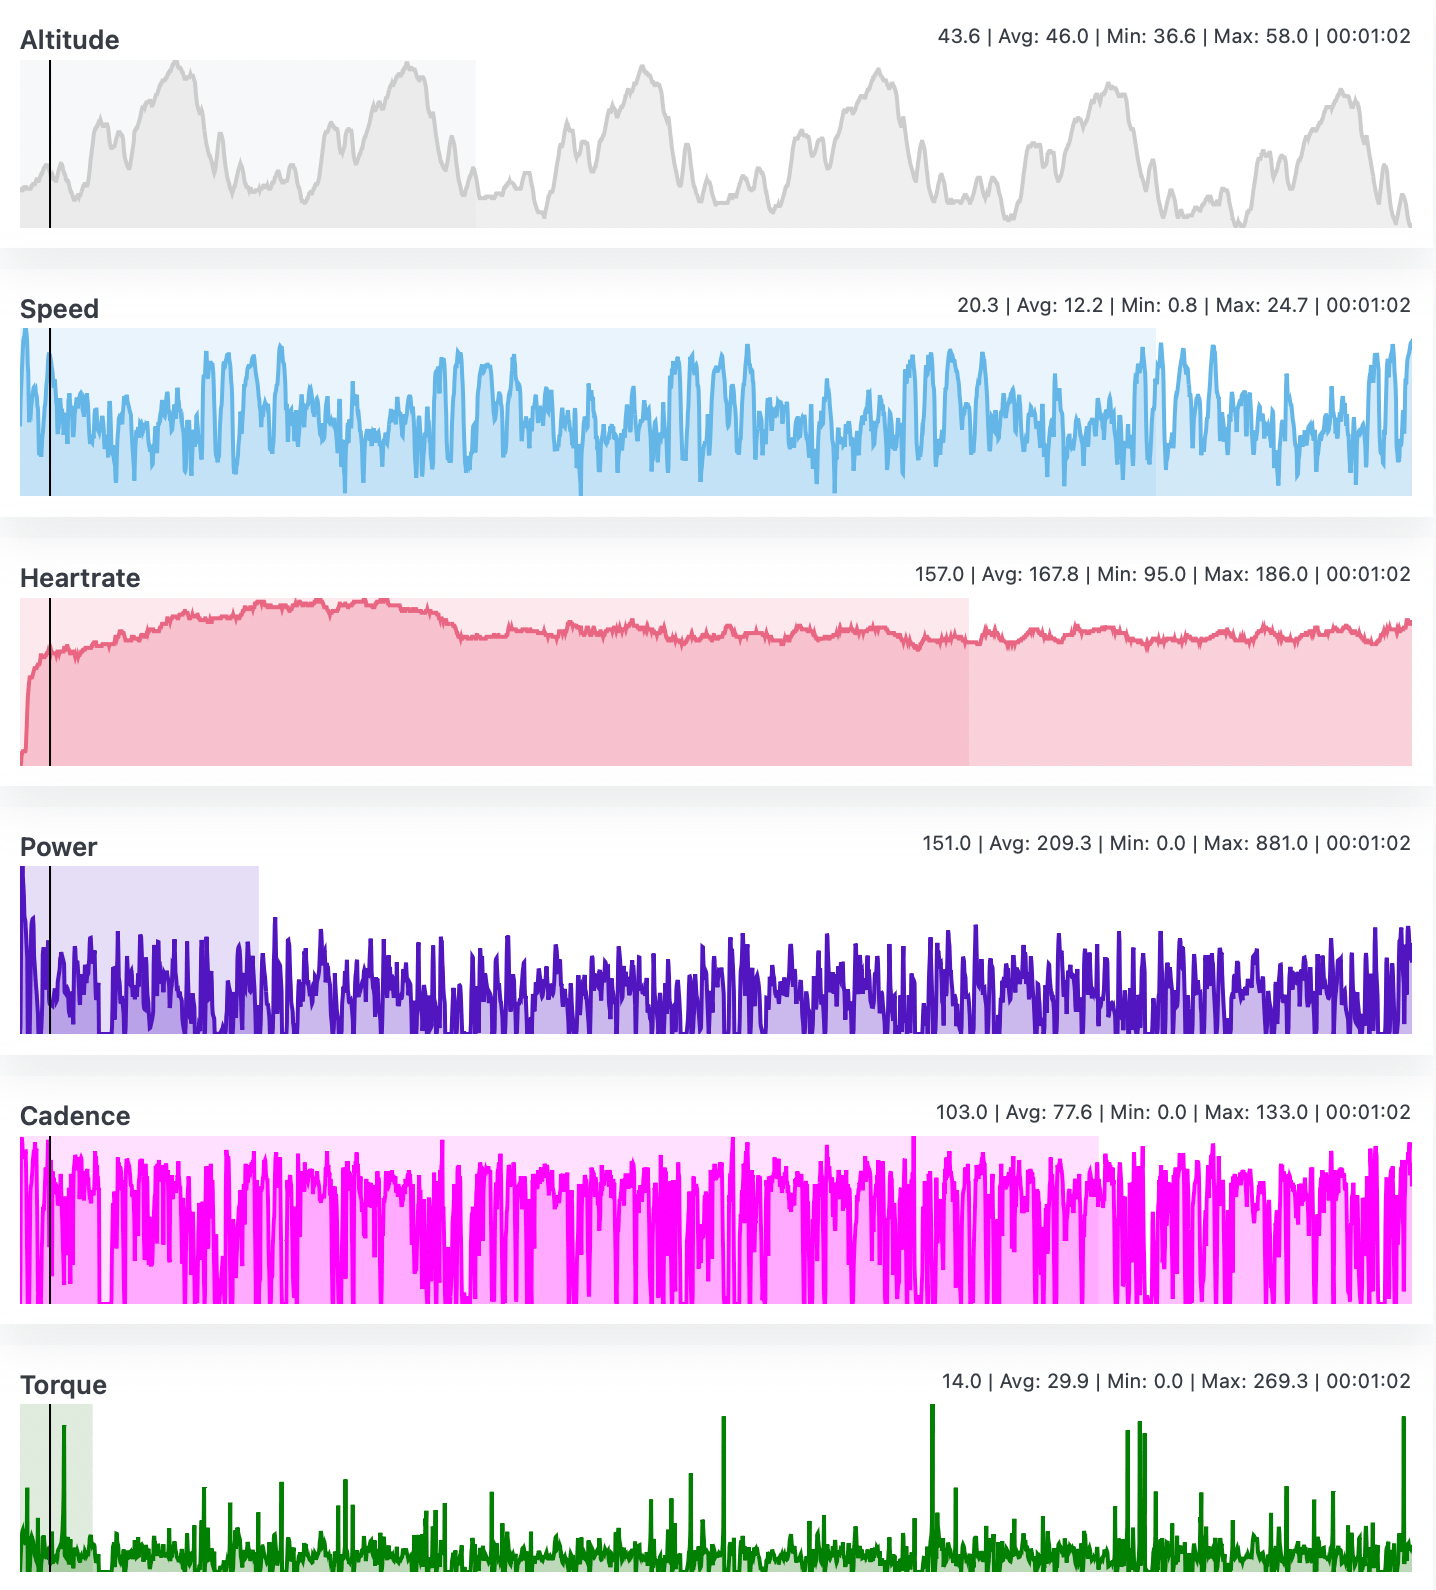 All the charts
The following charts are displayed:
- Altitude shows the elevation of the tracks in meters or feet
- Speed shows the speed of the rider in kilometers per hour or miles per hour.
- Heartrate displays the heartrate of the rider in beats per minute..
- Power displays the power output of the rider in watts.
- Cadence shows the cadence of the rider in pedal revolutions per minute.
- Torque displays the force the rider applies to the pedals in Nm (Newton millimeter).
With the smoothing slider the charts can be made less jagged, it filters out spikes and makes it easier to spot trends.
 Chart Smoothing Slider
Step 8: Using the Zone Legend
The Zone legend provides an overview of the zones displayed in the Map. It displays the following info.
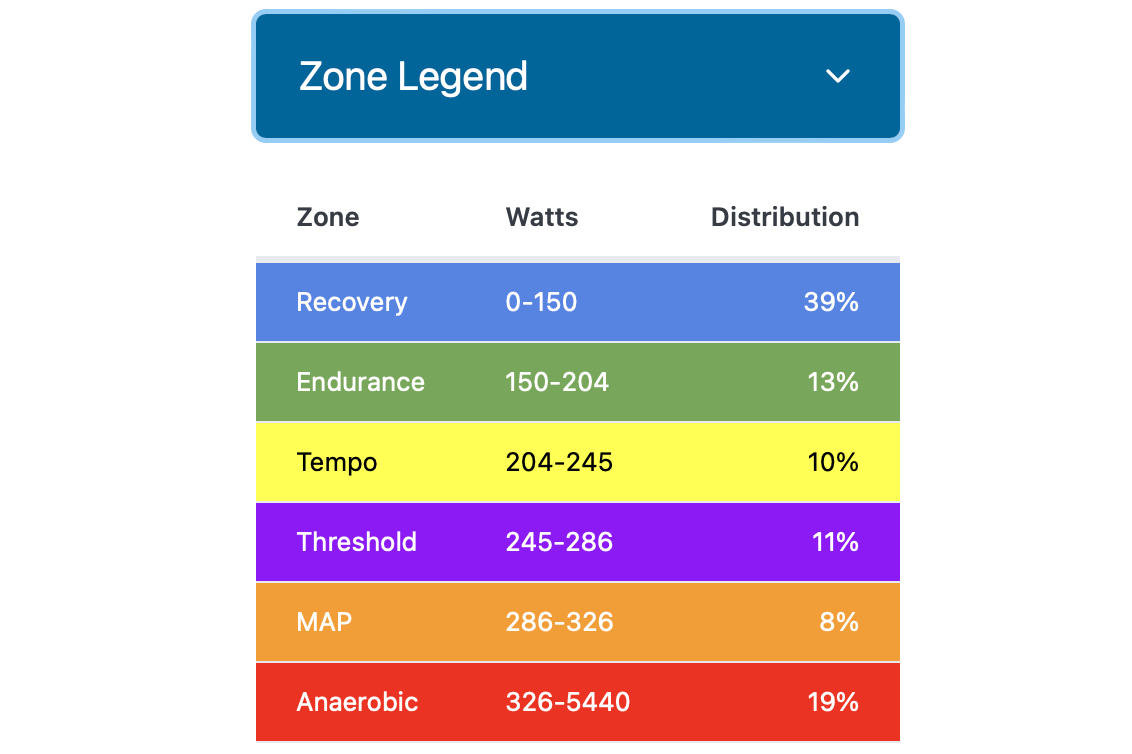 Zone Legend
- Zone, the name of the zone, this differs per map type. But for example the the Power Zone map has the zones: Recovery, Endurance, Tempo, etc.
- Zone ranges, these display the uppper and lower boundaries for a zone.
- Distribution, this columns displays the total time spend in each zone in percentages.
- Zone Color, is displayed in the background of the table row. It matches the colors on the map.
Step 9: Using Playback
Playback is a fun feature and allows you to playback the race, by automatically running throught the datapoints.
 Playback controls
When playback is running; the yellow map marker as well as the current datapoint marker on the charts are updated, including the current value and timestamp in the summary, as well as the horizontal bar in the charts.
You can choose between five different playback speeds. From realtime (1x), to slow-motion (1/4x and 1/2x) to faster (5x and 10x). With the stop button the playback stops.
Step 10: Configuring the settings
In the Settings section we can confugre the following values:
 Settings
- Functional Threshold Power - specify your FTP.
- Heartrate Threshold - specify your Heartrate Threshold (HRT)
- Units - indicate whether you want the system to show metrics or imperial units.
- Lap overlap radius - sets the sensitivity of finding the lap detection. Set to less sensitive (higher) when too many laps are detected and lower if not enough laps are detected.
Step 11: Reviewing the Feature history
The history section shows all the new Lap Track features in chronological order, starting with the most recent addition first.
 History
Conclusion
Congratulations! You've completed the Lap Track Racing tutorial and are now ready to start analyzing your racing performance. Remember to explore the different sections of the interface, analyze your performance, and share your results with others. With Lap Track Racing, you'll be able to take your racing to the next level and become a better crosser. Happy racing!